Case Study - The $3.04M Impact: AI Demand Forecasting in Action
An illustrative scenario showing how reducing forecast error from 35% to 15% for a 50K units/month retailer unlocks millions in working capital and revenue.
- Client
- Mid-Market Retailer
- Year
- Service
- ML Model Development, Data Integration, Custom Dashboard

Case Study - The $3.04M Impact: AI Demand Forecasting in Action
A real-world example showing how precision in demand forecasting translates directly to bottom-line impact. When you're moving 50,000 units monthly, every percentage point of forecast accuracy matters.
The Scenario
Consider a mid-sized retail chain moving 50,000 units per month across 28 locations. Each unit has an average cost of goods sold (COGS) of $40, generating monthly revenue of $3.2M at a 37.5% gross margin. This represents a typical profile we see across fashion, home goods, and specialty retail.
The challenge: their manual forecasting process yields 35% mean absolute percentage error (MAPE), leading to chronic stockouts and overstock situations. Here's how improving that to 15% MAPE through AI transforms the business economics.
Key Metrics
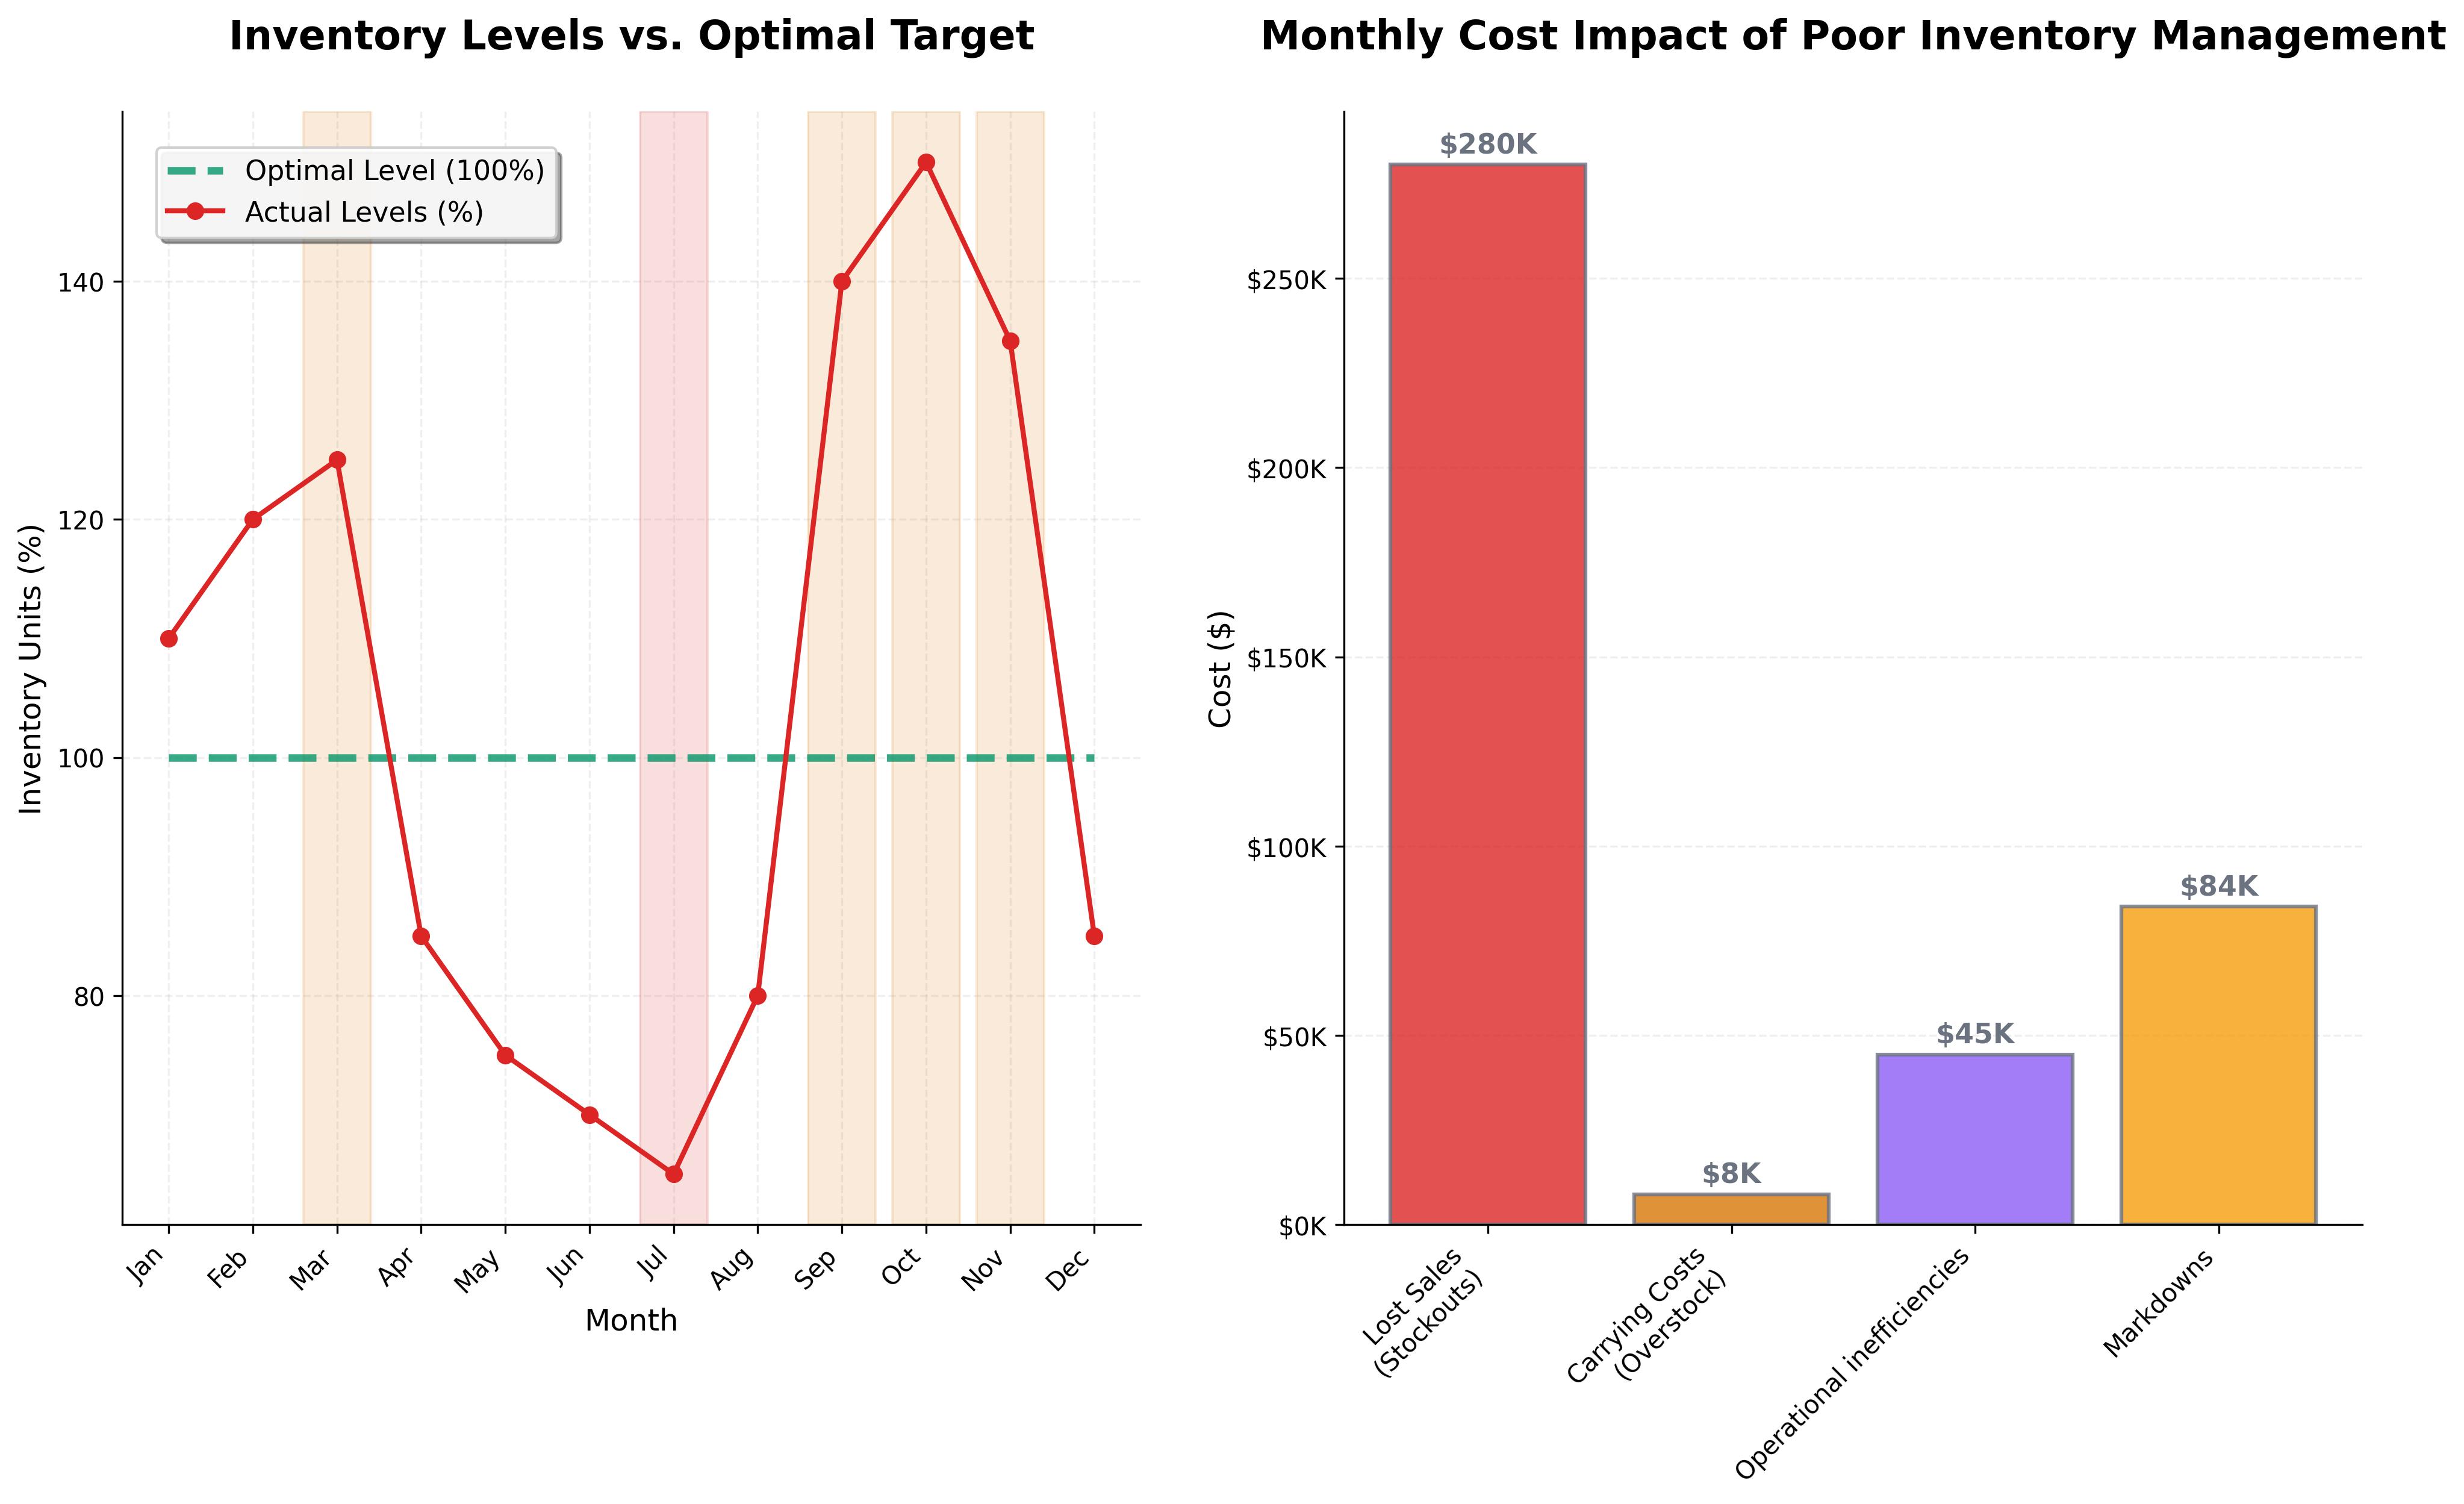
The Economics of Poor Forecasting
Let's examine the financial impact of 35% forecast error on a retailer moving $2M in inventory monthly:
Status Quo: Manual Forecasting
35% MAPE across 50K units/month means 17,500 units are significantly mis-forecasted each month.
Stockout opportunity cost: $280K monthly
When 8,750 units stockout (17.5% × 50K), lost sales at $64 average selling price = $560K. At 50% conversion recovery rate = $280K in lost revenue monthly
Excess inventory carrying costs: $92K monthly
8,750 overstocked units × $40 COGS × 28% annual carrying cost rate ÷ 12 months = $8,167 monthly. Plus markdown pressure: 15% markdown on $560K excess inventory value (8,750 units × $64 retail) = $84K monthly
Operational inefficiency: $45K monthly
Store managers spending 6 hours weekly on manual forecasting across 28 stores × $30/hour burdened rate = $21K monthly. Emergency procurement and expedited shipping = $24K monthly
Working capital opportunity cost: $1.9K monthly
Excess inventory of 8,750 units × $40 COGS = $350K in working capital tied up. At 6.7% weighted average cost of capital = $23K annual opportunity cost ($1.9K monthly)
Total Monthly Impact: $419K
This represents approximately 35% of the gross profit being lost to forecasting inefficiencies alone.
The AI Solution: From 35% to 15% MAPE
Through advanced machine learning and data integration, error can be reduced from 35% to 15% MAPE. Here's the mathematical transformation that unlocked $3.04M in annual value.
AI-Powered Forecasting
15% MAPE means only 7,500 units mis-forecasted monthly—a 57% reduction in forecast error.
The Mathematical Impact
Stockout Reduction
Excess Inventory Reduction
Working Capital Liberation
An often overlooked impact comes from working capital optimization. Here's the math:
Working Capital Calculation
• Base inventory: $2M monthly
• Excess stock: 8,750 units × $40 = $350K
• Total tied capital: $2.35M
• Base inventory: $2M monthly
• Excess stock: 3,750 units × $40 = $150K
• Total tied capital: $2.15M
• Capital freed: $200K
• Annual opportunity cost savings:
• $13K at 6.7% WACC
Technical Implementation
The 57% reduction in forecast error comes from a systematic approach combining multiple data sources and ML models.
Multi-source data integration
Historical sales, weather data, local events, promotional calendars, and competitor pricing— creating hundreds of features for each forecast
Ensemble modeling approach
Combining ARIMA (trend detection), Prophet (seasonality), and LightGBM (complex patterns) models, weighted by historical performance per product category
Hierarchical reconciliation
Ensuring forecasts are mathematically consistent at all levels, from store → department → category → SKU levels, eliminating the planning gaps that create inventory imbalances
Probabilistic outputs
Instead of point estimates, generating confidence intervals that enable risk-based ordering decisions: "95% confidence this product will sell 145-185 units next week"
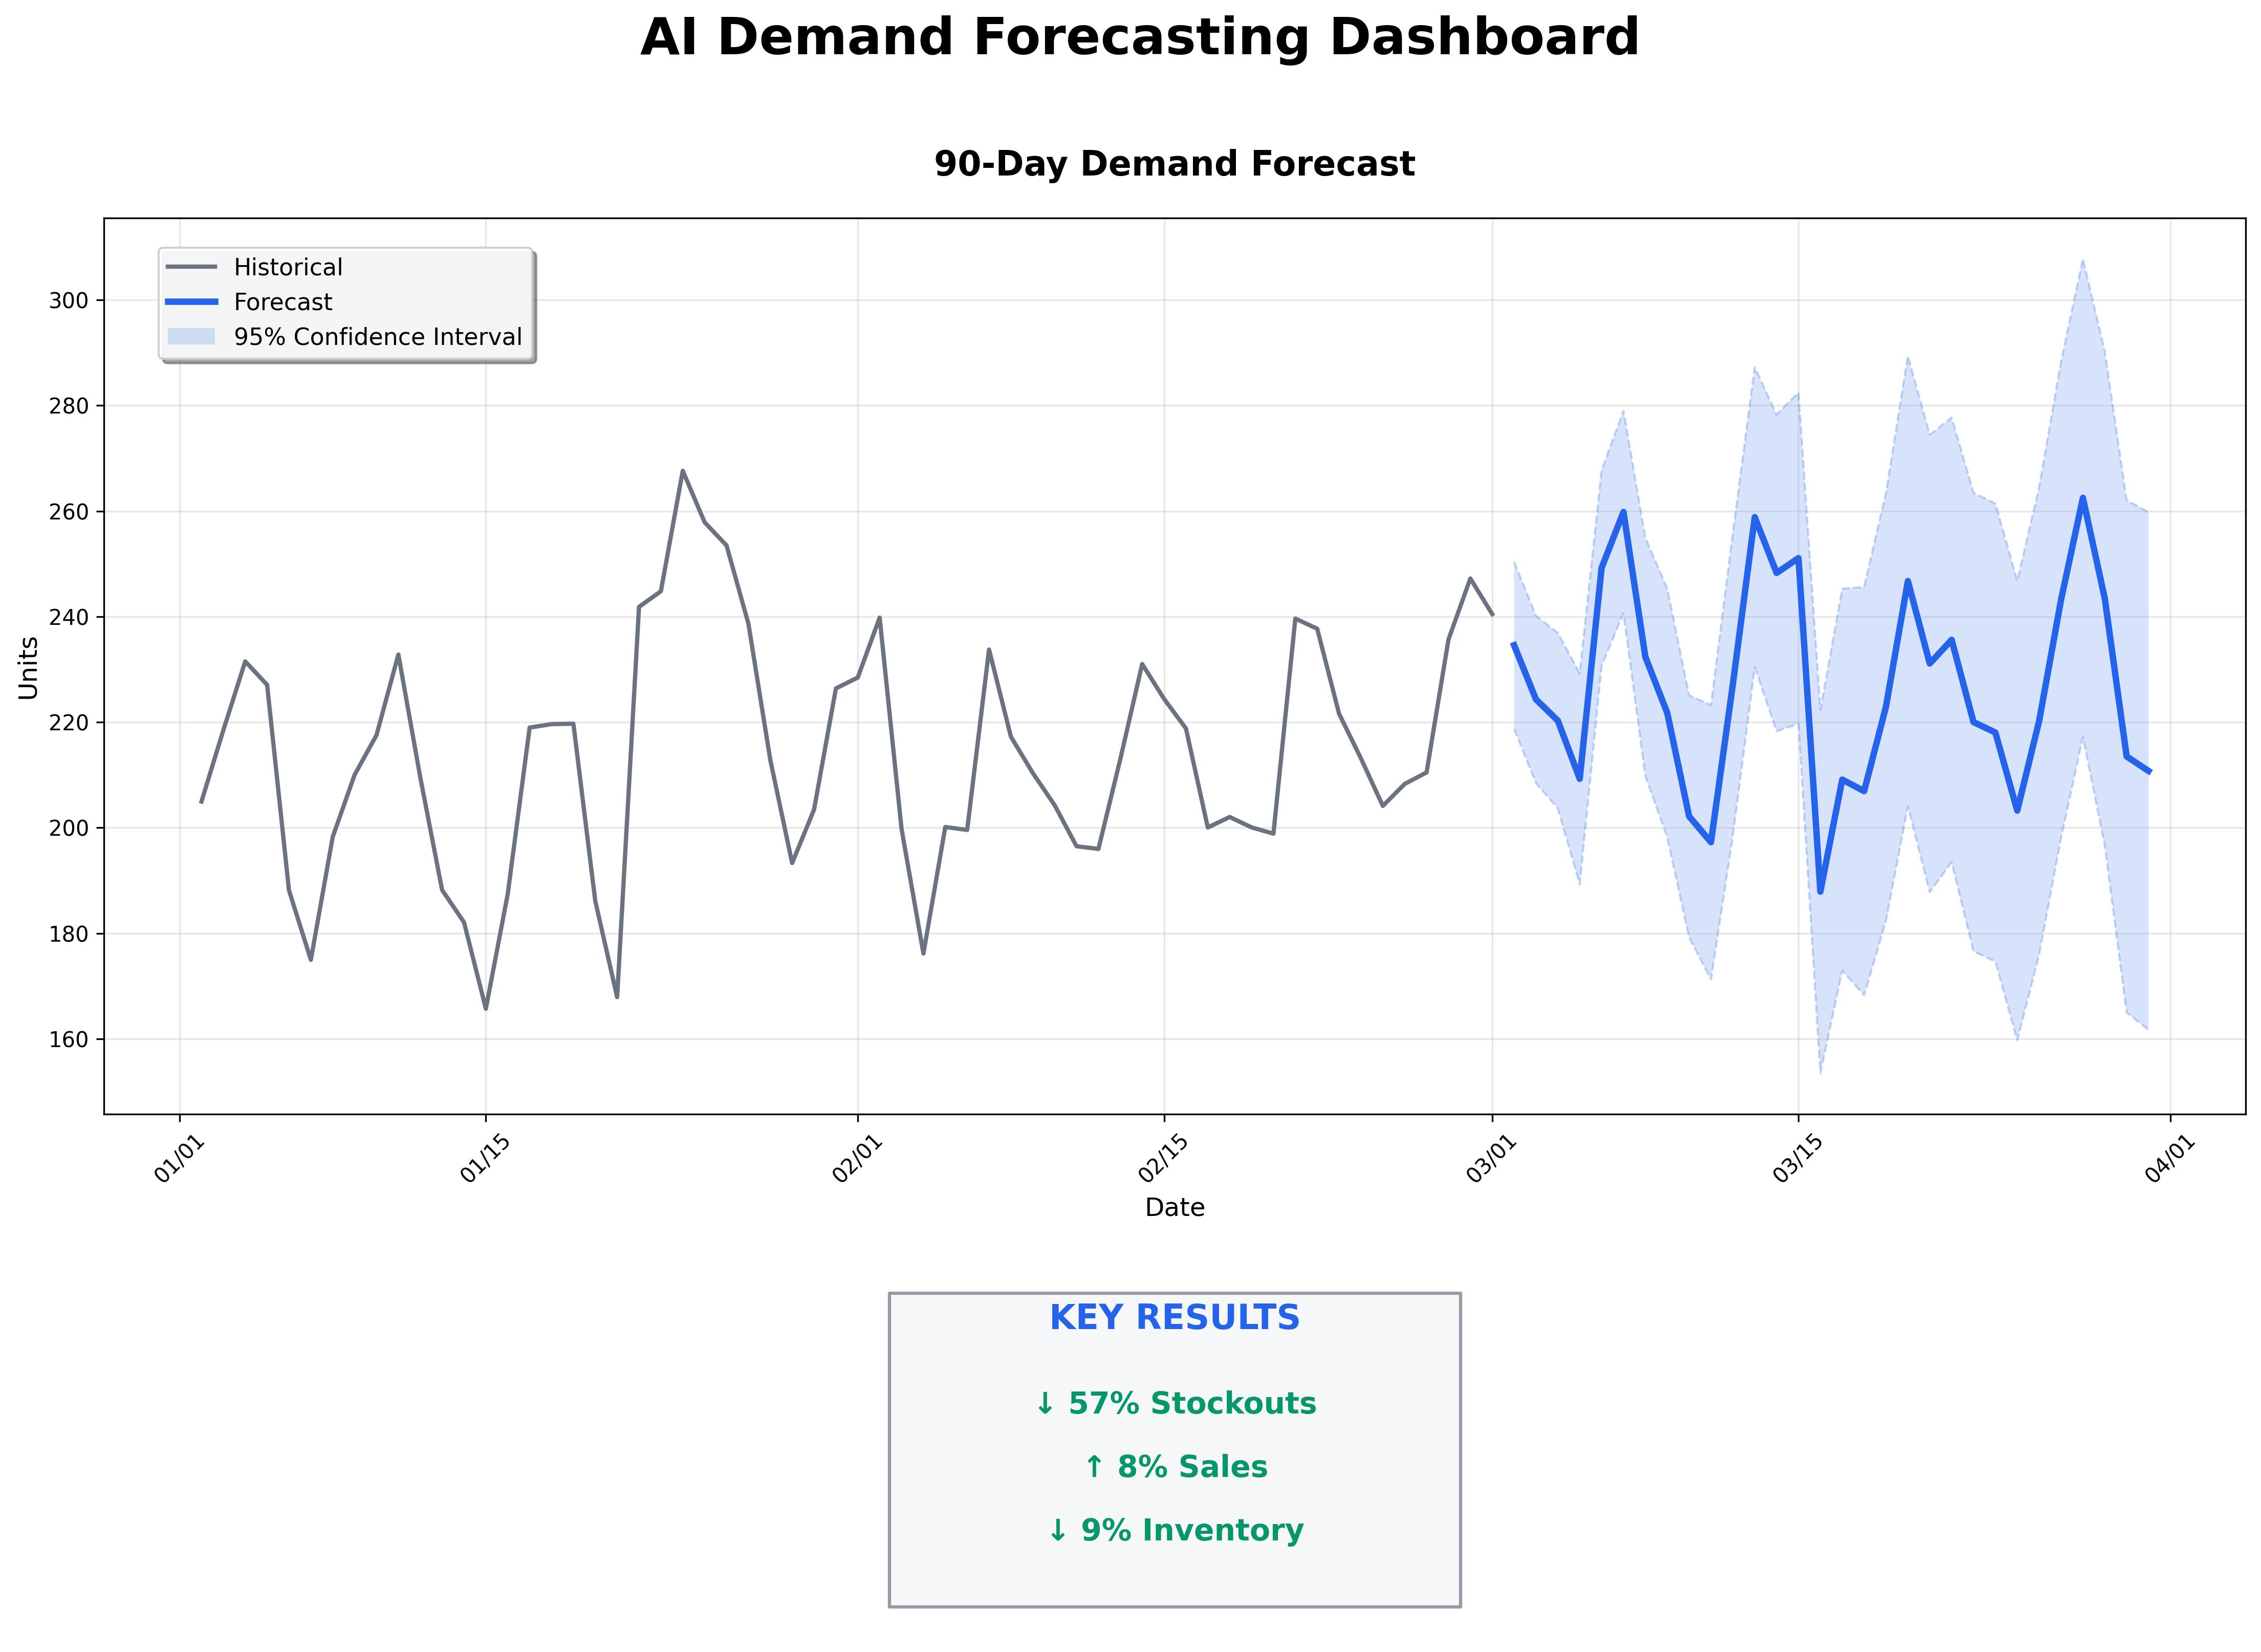
Building this level of forecasting precision required a systematic approach. Behind the forecast curves lies a sophisticated ML pipeline that processes hundreds of variables.
Data Preparation
Historical sales data has to be cleaned, normalized, and enriched with external factors like weather, holidays, and local events.
Feature Engineering
Specialized features capturing seasonality patterns, promotional effects, and product lifecycle stages.
Model Training
Multiple forecasting models trained on different time horizons (daily, weekly, monthly) and product hierarchies.
Model Evaluation
Models need to be rigorously tested against historical data, with particular focus on forecast accuracy during demand spikes and seasonal transitions.
Phase 3: Operational Integration
Even the most accurate forecasts are useless if they aren't actionable. Users need intuitive tools that integrated with their existing workflows.
Interactive dashboard
Custom-built visualization platform showing forecasts, confidence intervals, and key performance metricsAutomated alerts
Proactive notifications for potential stockouts, overstock situations, and unusual demand patternsOrdering recommendations
Actionable purchasing suggestions based on forecasts, current inventory, and lead timesWhat-if analysis
Tools to simulate the impact of promotions, pricing changes, and external eventsERP integration
Direct connection with existing inventory management systems for seamless workflow
The Bottom Line: $3.04M Annual Impact
Annual Financial Impact Breakdown
For this retailer, every 1% improvement in forecast accuracy translates to roughly $150K in annual value. The 20 percentage point improvement (35% → 15% MAPE) delivered transformational results.
Implementation Insights: Making It Real
Start with high-volume categories
Focusing on products representing 60% of revenue can deliver 80% of the potential value in first 90 days— classic Pareto principle application
Build trust through transparency
Forecast explanations like "High confidence due to consistent seasonal pattern + weather correlation" can increase user adoption rates
Automate the easy decisions
For products with >85% forecast confidence, automate reordering to reduce manual workload, while maintaining service levels
Create feedback loops
Store managers reporting "forecast felt wrong" helps improve model accuracy through local knowledge integration
Scaling Economics
Why This Scales
The math becomes more compelling at scale. A 100-store chain moving 150K units monthly would see:
- • $9.1M annual value from same 20-point MAPE improvement
- • $600K in freed working capital for growth initiatives
- • 3,650% ROI on implementation investment
Future Expansion Roadmap
This scenario shows how success in demand forecasting could expand into a comprehensive retail intelligence platform:
Dynamic Pricing
Integrating forecasts with automated pricing adjustments to optimize margins and reduce excess inventory
Supply Chain Optimization
Extending forecasting upstream to optimize supplier orders, production schedules, and logistics planning
Personalized Marketing
Leveraging customer-level prediction models to drive targeted promotions based on individual buying patterns
New Store Planning
Using forecasting models to optimize new store locations and initial inventory assortments based on demographic analysis
Calculate Your Potential Impact
Use this framework to estimate your own demand forecasting ROI. The math is surprisingly consistent across retail categories:
Interactive ROI Calculator
Your Business Metrics
Expected Improvements
Methodology: Calculations based on industry benchmarks and the case study above. Target MAPE of 15%, 50% stockout recovery rate, 28% annual carrying costs, and 6.7% weighted cost of capital.
- Reduce forecast error by 15-20 percentage points
- Free up 15-30% of working capital
- Improve inventory turns by 25-40%
- Achieve 800-1,500% ROI in year one
The math of demand forecasting is compelling because the benefits compound. Better forecasts lead to better inventory decisions, which improve cash flow, which enables better purchasing terms, which improve margins. For retailers ready to move beyond gut-feel forecasting, the opportunity is substantial and measurable.
- Customized to Your Business.
We don't believe in one-size-fits-all solutions. Our forecasting models are built specifically for your product mix, customer base, and business goals.
- Focused on ROI.
We prioritize high-impact areas that will deliver the most significant financial returns in the shortest timeframe.
- Built for Real Users.
Our solutions are designed with store managers and inventory planners in mind, with intuitive interfaces and actionable insights.
- Continuously Improving.
Our systems learn and improve over time, adapting to changing customer behaviors and market conditions.